Monitoring Foreman, Katello and Red Hat Satellite 6
Foreman, Katello and Red Hat Satellite 6 users have multiple possibilities to monitor infrastructure health. Beside the Foreman host, also managed systems and defined software content are worth monitoring.
Foreman dashboard
Foreman/Katello and Red Hat Satellite offer a dashboard with some widgets that can be used for monitoring hosts and products. The widgets can be ordered and removed. The following metrics are available:
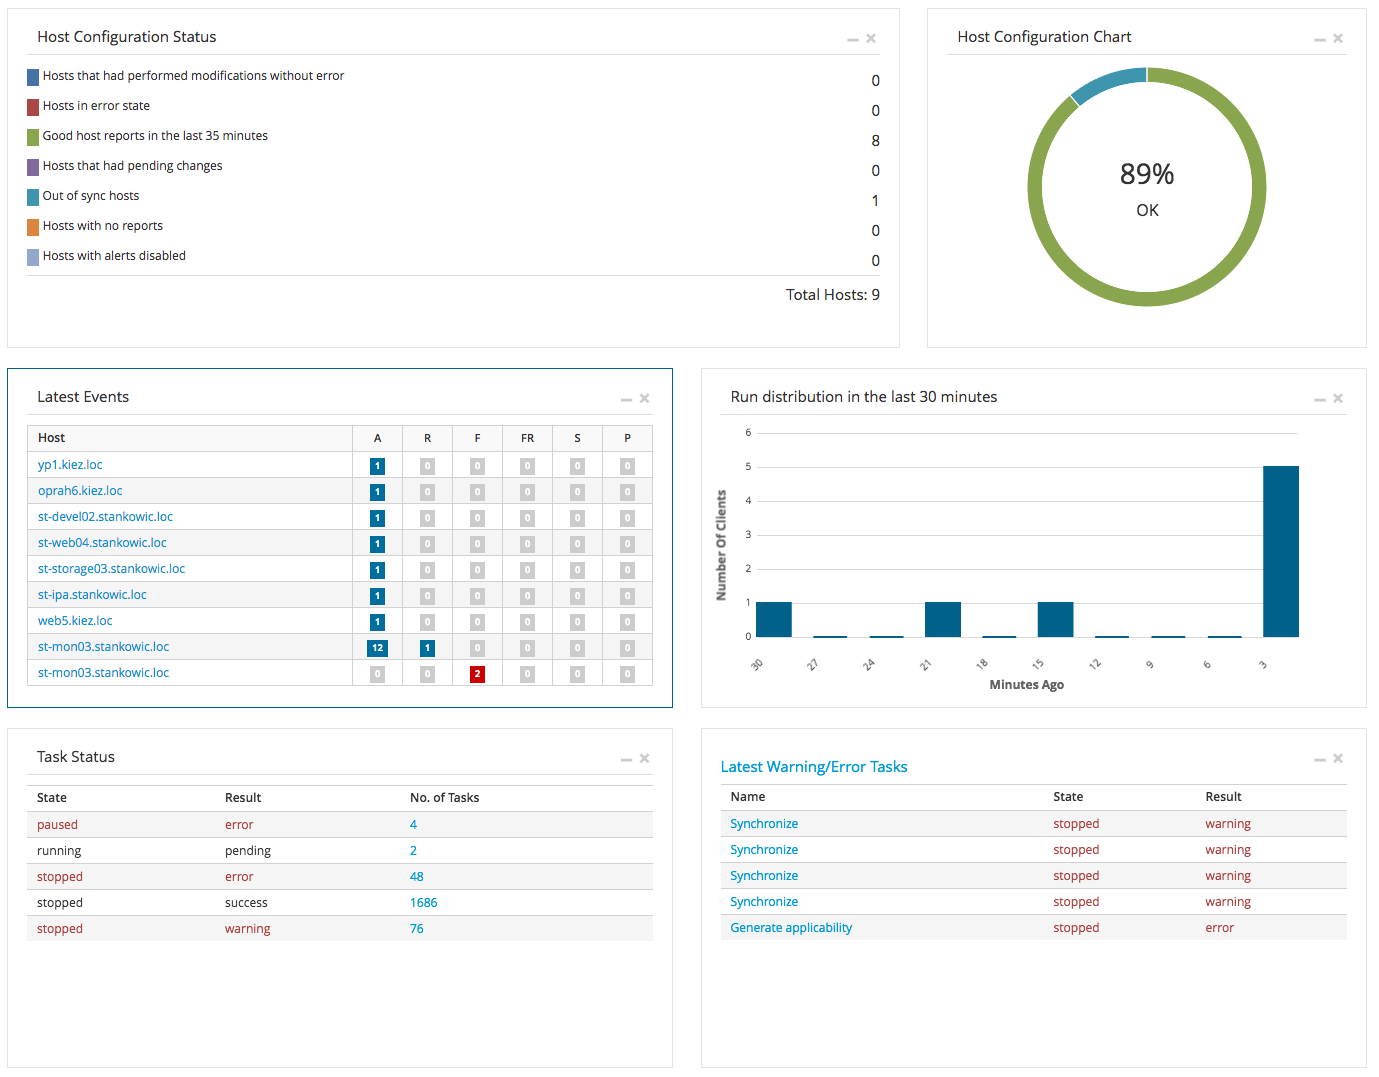
- Host configuration status overview
- Last events
- Tasks and last warnings and errors
- Content view synchronization and versions
- Last errata
- Expiring subscriptions
To lookup current product synchronization tasks and errors, it is advisable to additionally check the overview underneath Content > Sync Status.
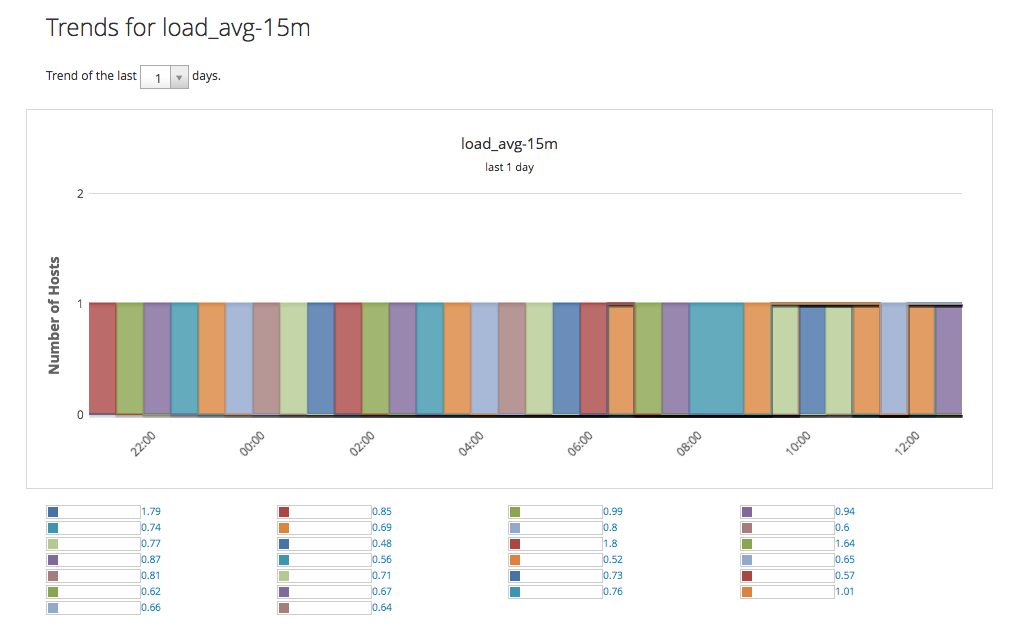
Trends
Another option is the possibility to gather trends within Foreman. Especially, system facts (facter) gathered by Puppet can be captured per system in regular time intervals. The list of information available from Facter is quite lone (external tools can also extend them). As a result, system information can be visualized - some examples:
- Hard drive and file system information
- CPU and load metrics
- Memory metrics
By clicking Monitor > Trends in the Foreman web interface, an assistant for defining trend capture is started - e.g. for a load average system fact:
- Trend type: Facts
- Trendable: load_averages::15m
- Name: load_avg-15m
Depending on the system configuration it might be possible that the Foreman cronjob needs to be altered. The appropriate configuration file (/etc/cron.d/foreman) should contain the following lines:
1# Collects trends data
2*/30 * * * * foreman /usr/sbin/foreman-rake trends:counter >>/var/log/foreman/cron.log 2>&1
In the web interface, a trend looks like this:
Statistic graphs
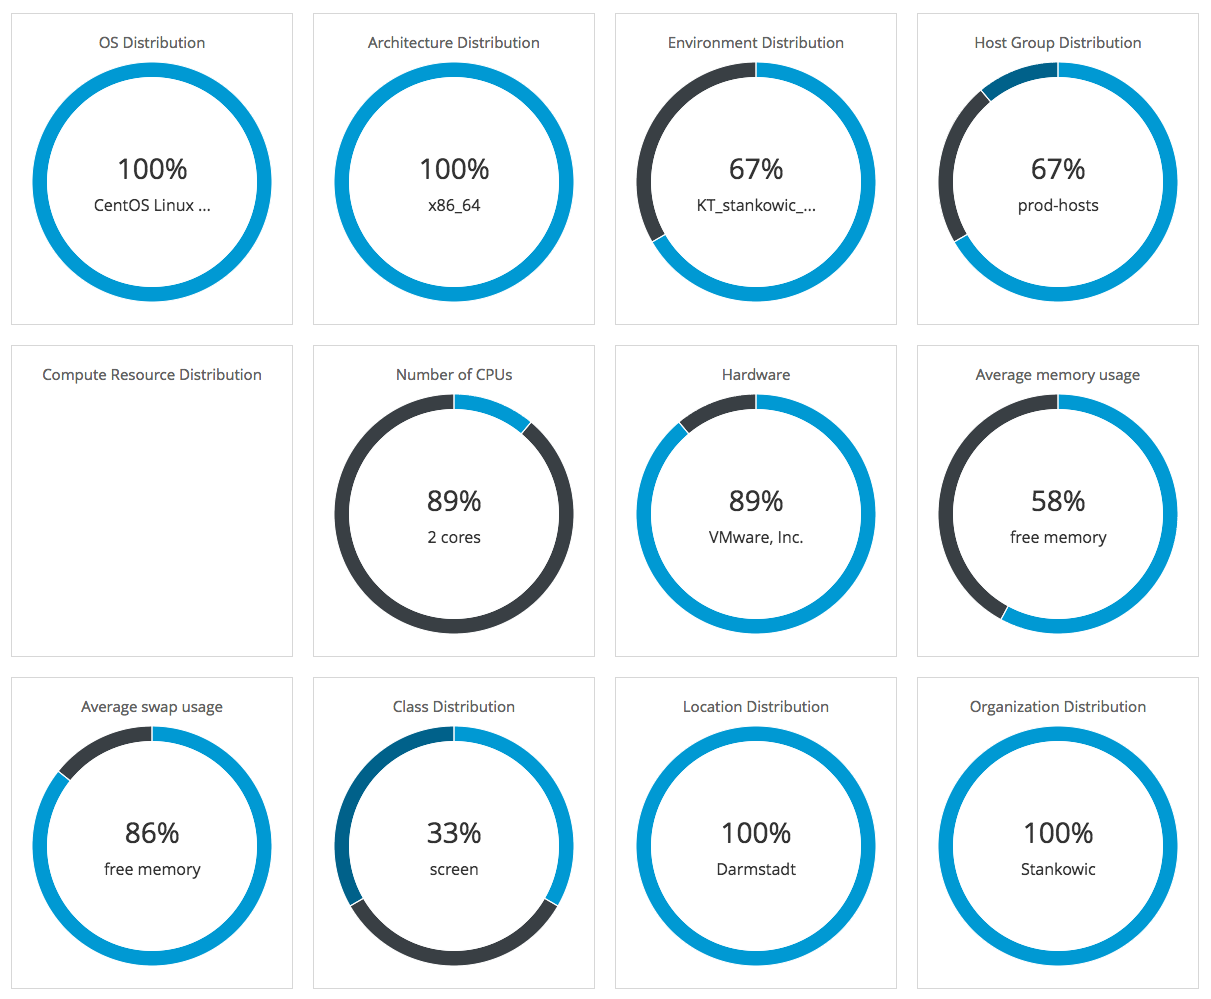
Especially for bigger system landscapes, statistic graphs included in Foreman can assist with getting an overview over the infrastructure variety. Doughnut charts visualize the distribution of:
- Operating systems and architectures
- Puppet classes und environments
- CPU cores as well as memory and swap usage
Clicking the values will list the appropriate systems.
Nagios and Icinga(2)
Of course, the Foreman system should be monitored as well - e.g. using Nagios or Icinga(2). It is advisable to monitor the following metrics:
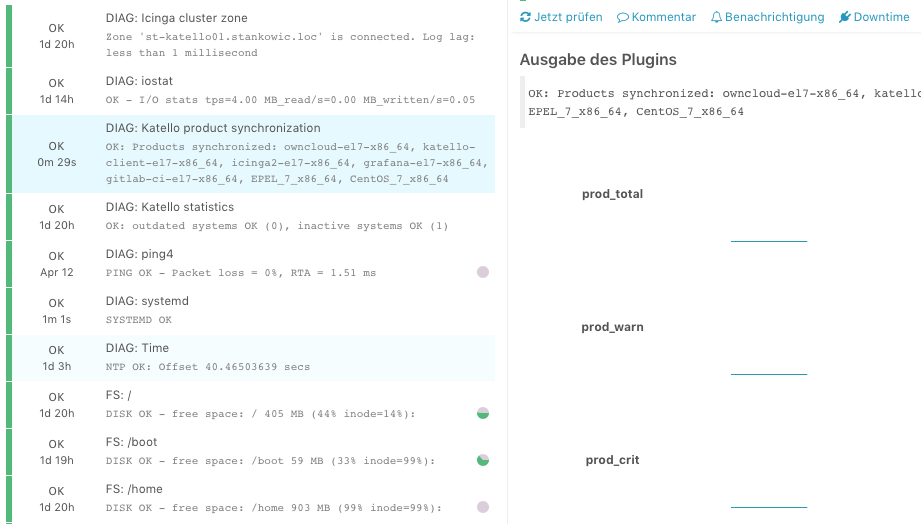
- CPU consumption and memory usage
- NTP time synchronisation
- File system usage (
/var/lib/mongodb,/var/lib/pgsql,/var/lib/pulp) - Relevant network services (http/https, Puppet) and processes (foreman-tasks, pulp,...)
I was missing monitoring application-relevant metrics, such as the patch level of maintained systems or product synchronization. For Spacewalk I created appropriate monitoring plugins check_uyuni_currency and check_repodata, that I managed to migrate to Foreman/Katello thanks to the well-documented API:
check_katello_currency- checking software complaince of managed systems, gathering generic statistics (outdated and inactive systems,...)check_katello_sync- monitoring product synchronization
Of course, you can also gather these information using the Foreman web interface - but this requires multiple clicks. In addition, I'm using my monitoring system as central unit for events that needs to be reported via mail.
Grafana dashboard
Especially Icinga2 users will get to know Grafana sooner or later. Designed as generical visualization and dashboard software, Grafana integrated perfectly into Icinga2 in order to consolidate and process performance data. There are plenty of graph types and forms to process data. On the grafana website, there are plenty of pre-defined metrics that can be imported and used easily.
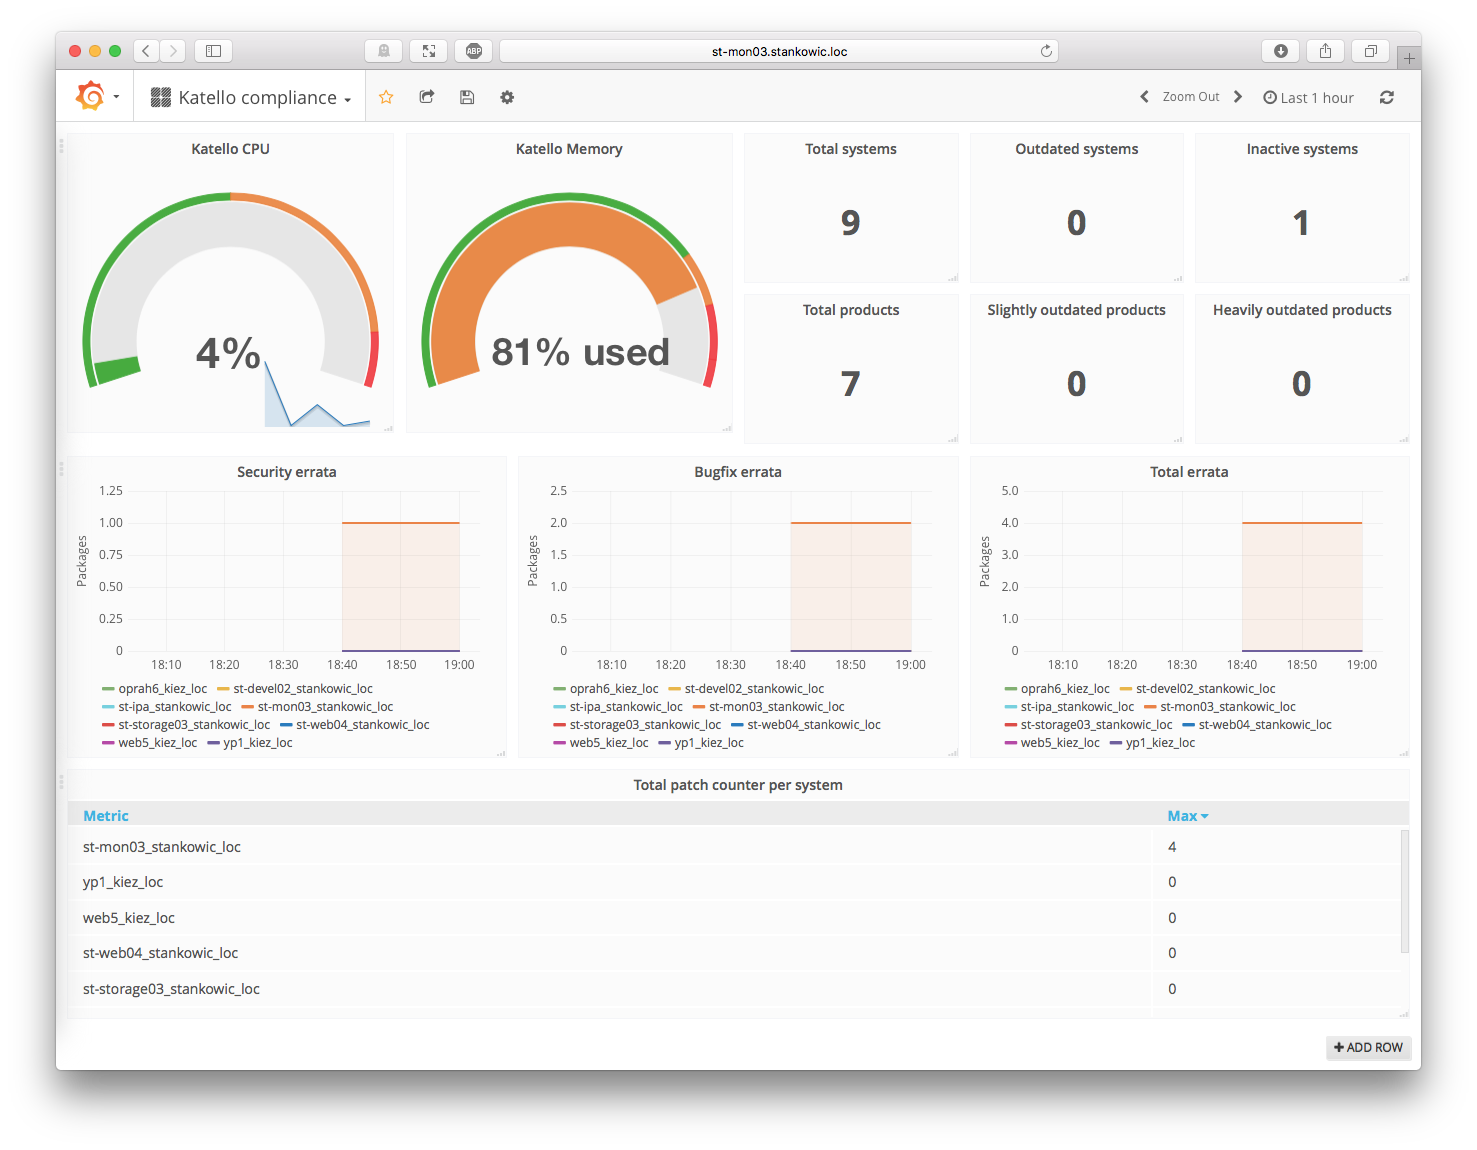
I created a dashboard for monitoring Foreman with the following metrics:
- CPU and memory usage of the Foreman/Katello system
- Amount of defined, outdated and inactive systems
- Amount of defined and slightly and heavily outdated products
- Counter graphs for security fixed, bug fixed and generic errata
- Update counter per system
As a result, I have all major metrics on one single dashboard without needing to access Icinga2 and Foremann all the time. The dashboard can be downloaded from the Grafana website.